
Page 39 - Training for Promotion from Junior Rank to Senior Rank
P. 39
Practical English for Civil Servants
The Reason for Creating the Age-Friendly WISE Fullerton City
Presenting a Bar Chart
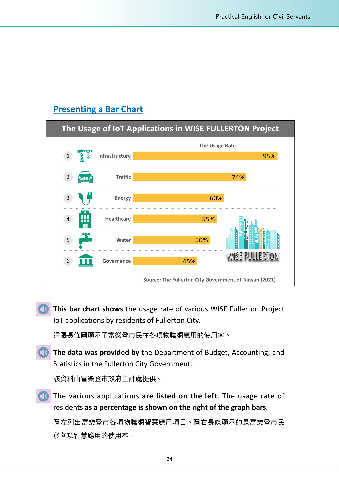
The Usage of IoT Applications in WISE FULLERTON Project
The Usage Rate
1 Infrastructure 95%
2 Traffic 74%
3 Energy 60%
4 Healthcare 55%
5 Water 50%
6 Governance 45%
Source: The Fullerton City Government of Taiwan (2021)
This bar chart shows the usage rate of various WISE Fullerton Project
IoT applications by residents of Fullerton City.
這張長條圖顯示了富樂登市民在各項物聯網應用的使用率。
The data was provided by the Department of Budget, Accounting, and
Statistics in the Fullerton City Government.
該資料由富樂登市政府主計處提供。
The various applications are listed on the left. The usage rate of
residents as a percentage is shown on the right of the graph bars.
圖左列出富樂登市各項物聯網智慧應用項目。圖右長條顯示的是富樂登市民
於各項智慧應用的使用率。
34